

Is Police Productivity Declining?
Why Policing is Ripe for Disruption

If you find yourself lying in the roaring fields some mostly sunny day, dreamily gazing at the drifting clouds, you may find your mind centering on core questions of life and meaning, pondering riddles of the universe, wondering, as I like to do, what exactly is disruption and is a disruption in policing inevitable? Or maybe not. But supposing you did…
It is universal to believe that the events of this moment are somehow unique in history. That the pace of change is unprecedented. Part of today’s political ennui and the rise of dangerous ethnic nationalism can surely be tied to a sense that too much has been disrupted, that too much has changed, and that the momentum of change is uninhibited. I can’t say I have a great deal of sympathy for this position because it argues for a perpetual immaturity, ignoring that the core of maturation—and thus wisdom—is change. But it is true that disruption is all around us.
COVID-19 was surely a global disruption, and a sad one, but the widespread take-up of vaccines is primed to be a countervailing disruption of similar magnitude. Those two forces of change—disease and renewal—have in turn disrupted all manner of business and government. I can’t say I missed dining out much, but I did miss the movies, but that industry post-pandemic is clearly withering. Movie-going, they say, is ripe for disruption.
The list of industries that have recently been disrupted is too long to list. Hotels, currency, taxis, credit cards, office space, conference calls, newspapers. That list took ten seconds to create, I’m sure there is a better one. And the disruption will continue. Retail banks are surely next—as most of us transition to fully online life, branch offices in my area are springing up like mold after the flood, or Starbucks in a petri dish. Or whatever. The two big advances in retail banking—automation and access to credit for the small borrowers that banks have mostly abandoned—seem to argue for less physical presence. But instead, there is more. This is often what happens in those critical pre-disruption moments, where the legacy institution doubles down on a strategy that has clearly already failed. In the next act, the disrupters shovel dirt on the coffin.
This brings me to what I really want to talk about, which is the potential for disruption in policing. Policing is, or at least should be, a public good and the public sector is inarguably more difficult to disrupt than the private sector. But with disruption all around us, surely the public sector is next.
The key question is, what are the attributes of a system, sector, or industry that makes it amenable to disruption, and does the government in general, and policing in particular, have those attributes? Googling the question of what makes an industry ripe for disruption will take you into a hellscape of multi-level marketing like hype. Instead, let me turn to my favorite business scholar of No Mercy/No Malice fame, Professor Scott Galloway, for two indicators that predict an imminent disruption of an industry.
One predictor is the “back to the past” test. This one works a little better in a bank or a movie theatre, but the idea is to go to a public place, close your eyes and imagine it is 1985, and then look all the way around you and ask yourself, would policing have looked different in 1985? Police patrol vehicles have certainly gotten an upgrade, uniforms are now combat-ready as are weapons, but there is probably little discernible difference in policing attitudes and behaviors from 1985, at least in the eyes of an average citizen.
The second predictor brings a little more heat. According to Galloway, a key indicator of the potential for an industry to be disrupted is
“the price of your product or service, over time, vs. inflation. If the firm or sector has raised prices faster than inflation, without an underlying increase in productivity, then you’re ripe to get your lunch eaten.”
Let’s unpack that a little and see how it applies to policing. For policing, the analogy to price would be the cost per sworn officer, which seems to have gone up over time, though the data are a little sparse. In a recent report, the Urban Institute finds that
“[f]rom 1977 to 2018, in 2018 inflation-adjusted dollars, state and local government spending on police increased from $43 billion to $119 billion, an increase of 175 percent.”
A 2008 Bureau of Justice Statistics report finds that “public expenditure on policing in the United States more than quadrupled between 1982 and 2006 increasing about eight percent every year.
So the price of policing is going up and of course, at 8 percent a year, that’s way faster than inflation. But, I think crime is a better metric than inflation to measure the risk to policing of unwanted disruption. If crime is steady, and police costs are going up, then that suggests we are paying more for the same results (which is of course what causes disruption). But, what if the situation is worse and the price is going up while crime is going down? That means paying more and more for less and less.
So, putting all of this together, if we apply Galloway’s disruption predictor to policing then a key indicator of how ripe policing is for disruption is, ‘the cost of policing, over time, vs. crime. If the price of police increases faster than crime, without an underlying increase in productivity, then you’re ripe to get your lunch eaten.’
And that, finally, is what I want to talk about.
First, the conclusion

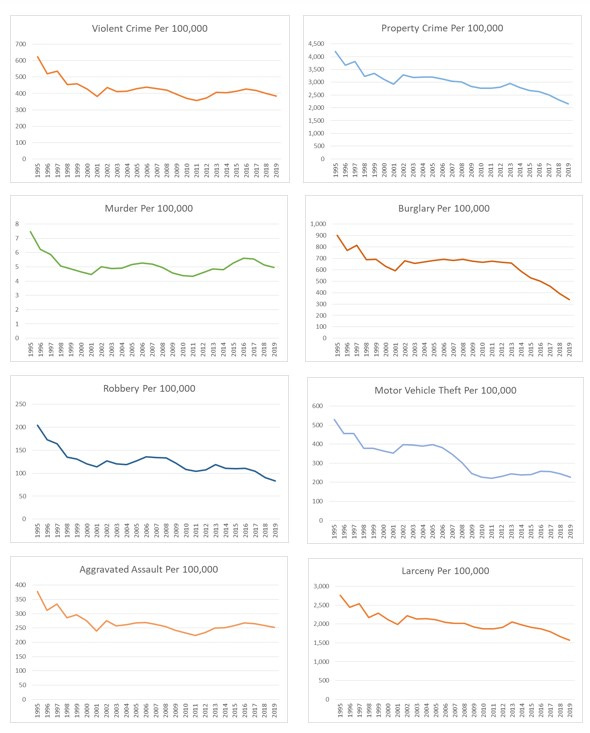
My first professional boss used to say about papers and presentations, “if you are going to show ‘em a bear, bring out the bear.” So, here’s the bear. Crime has declined since the mid-1990s (even more since the beginning of the 1990s). The number of police per capita has stayed the same. That means that the average law enforcement officer is policing fewer crimes.
It stands to reason then that the police will solve more cases since there are fewer of them but there are the same number of police (in police data jargon, solving more cases is equivalent to ‘clearing by arrest a higher percentage of cases’). But the clearance rate in 2019 looks indistinguishable from the clearance rate in 1995. It is the same, even though the number of officers is the same and there are fewer crimes. To me, that indicates that police productivity is declining.
So, to summarize, if the price of police increases faster than crime, without an underlying increase in productivity, then you’re ripe to get your lunch eaten.’
Number of Police and Changes in Crime
Let’s take a quick look at the data to see the trends in the number of police and the crime rate. I will use the FBI’s Uniform Crime Report data from 1995-2019, which is what is available in a consistent format and scope. (There’s a technical note at the end of this essay if you want to read more about the data used here). I note that 2020 data is not yet available from the FBI, and it is not clear when, or if, it will be available this year.
First, crime. As I have discussed elsewhere, crime is a pretty amorphous thing. The dramatic increase in homicides and shootings since March 2020 has really been about gun violence, while property crimes and other types of violence hold steady or decline. So, crime really hasn’t gone up, only violent crime, and shootings in particular. But that’s still really bad, really bad, and we should work much harder to solve the problem (which is really the point of this essay). But, in terms of police productivity, it is enough to establish that crimes of all types have fallen quite a lot since 1995.
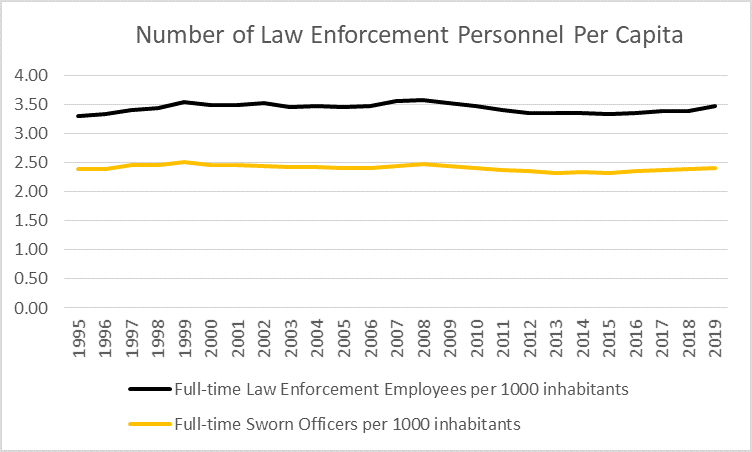
Having established that crime has declined and that spending on police has increased, let’s investigate whether the number of police officers has increased or declined. The black line shows the number of full-time law enforcement employees and the yellow line the number of full-time sworn officers (data are self-reported by each law enforcement agency).

Clearly, there is a general pattern of an increasing number of employees, although the Great Recession of 2008-2009 hit local governments hard. Following the recession, there is a several-year period of decline with the number of law enforcement personnel returning to pre-recession levels at the end of the series. Overall there is a real increase, 23.3% for all employees and 18.8% for sworn officers.
Of course, the number of Americans served by the police increased throughout the period. Overall, the number of full-time law enforcement employees is perhaps up slightly and the number of full-time sworn officers is essentially flat. There is no change in the quantity of policing.
Clearance Rates
In the absence of other data, it would probably be fair to assume that with declining crime and essentially the same number of police officers on the beat, that clearance rates would decline. If officers are performing the same activities in the presence of less crime to investigate, it stands to reason that the number of arrests per crime should increase. Or at least that would be my prior assumption.
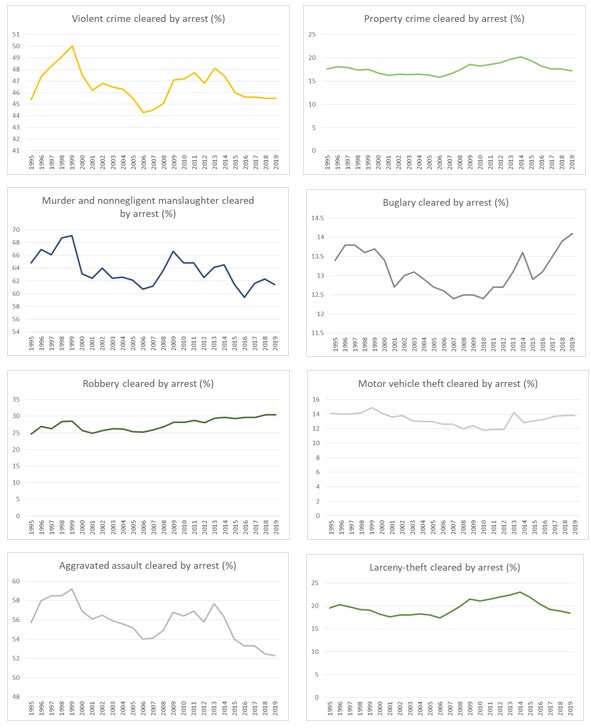
There is a lot of noise, to be sure. But looking at the top two graphics, violent crimes cleared by arrest and property crimes cleared by arrest, there is no change. There tends to be an increase when crime declines rapidly (1995-2000) and in types of crime that decline a lot—robbery rates fall by half during this time period, and robbery clearance rates increase as well, but nowhere near as quickly. And this is generally the pattern, there is a real decline in crime, but case clearance rates remain stable, only increasing modestly in the presence of big declines in crime.
Two quick notes. One explanation might be that when there is less crime, only hardened criminals are left as offenders. I have an unpublished paper that looks at this, by asking whether the recidivism patterns are different when prison populations decline rapidly. In general, the recidivism patterns were identical, suggesting the people convicted of a crime during high crime periods look pretty much indistinguishable from people who commit crimes in low crime periods.
The second note is that deterrence is the usual answer to the question, why did crime patterns change. Here, of course, the number of officers per capita remains stable throughout, so there is little difference of any meaningful change in the level of deterrence.
Police Productivity
OK, so now we are at the end, where we measure policing productivity and ask if it has indeed declined, given the evidence above. Measuring police productivity is a little bit of a challenge. It is interesting to note that there is little research on measuring police productivity—most of the contemporary scholarship I can find defaults to clearance rates as the key measure. While clearance rates seem an appropriate measure at any given moment in time, over a longer series, with crime rates increasing and decreasing in various ways, productivity should account for the amount of crimes police are attempting to clear via an arrest. To do that, our measure is:
Number of arrests per reported crime/number of sworn officers
Essentially, that is the clearance rate by officer. All else being equal, if police are more productive, clearances by officers will increase. If they are less productive, clearances by officers will decline. For ease of interpretation, the measure here is clearances per 100 officers, using the number of sworn law enforcement officers (using all employees would simply make the measure smaller).
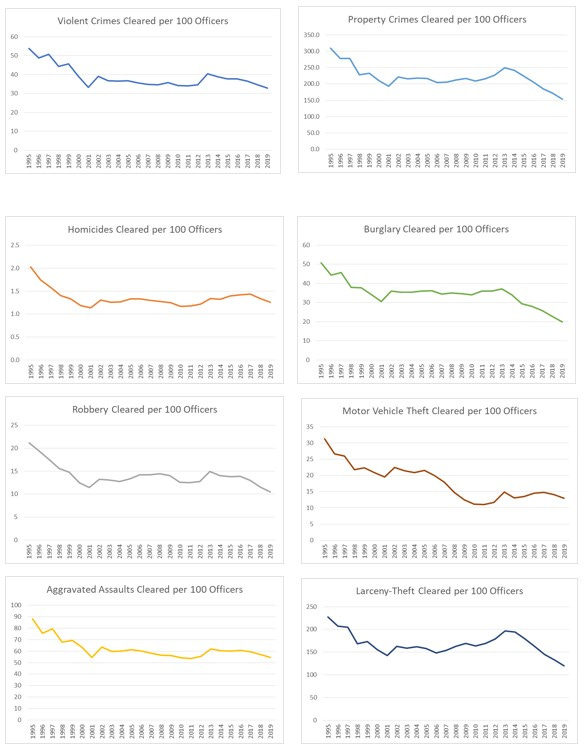
The pattern is clear. Using this metric of police productivity, clearances by the number of sworn police officers, police productivity is declining in the US.
Final Thought
There is a lot that can be done about this, big and small. I have argued that a much better policy is to redirect policing resources away from traffic stops and stops for disorder toward policing and investigating violent crime. This acknowledges that demand for policing services is increasing and has the unintended consequence of disrupting policing in a bad way. And there are any number of innovations to reduce gun violence, from policing-led initiatives to community-led initiatives to combinations of both.
There is much that can be done. First, we must acknowledge the problem.
Technical Notes: Data on the number of sworn officers, number of law enforcement personnel, number of reporting agencies, and population served by reporting agencies are taken from Table 74 of the FBI UCR data for 1995-2019 (Table 25 in 2016). The number of reporting agencies and the population they serve is not identical to the agencies reporting on clearance rates. 1995-2004 are available from the FBI in PDF, of the form: https://ucr.fbi.gov/crime-in-the-u.s/2002/02sec6.pdf. Data from 2005-2019 are available in Excel. Data on clearance rates from Table 25 (except for 2016, Table 17). All data in the analysis are from the FBI data except the number of violent crimes cleared which are my calculations.
Data on crimes by type and the population served are taken directly from the reporting agency. Since only 78 percent or so of law enforcement agencies report data covering about 91% of the US population, the numbers here are a little different from what is reported as national estimates.
With respect to police productivity, interestingly, there seems to have been a robust debate in the 1970s about whether clearance rates are the right measure. One of the proposed measures from a chapter by Harry Hatry (Wrestling with Police Crime Control Productivity Measurement) in a 1975 book on police productivity is “clearance rate per police department employee.” Since Harry Hatry is widely regarded as a founder of modern performance measurement, that is the measure I have selected (but click the link if you are interested in how complicated an issue this is).
Research Aside: Mass Shootings in Chicago go Unsolved
From @TheTrace, “The Chicago Sun-Times analyzed 212 mass shootings (defined as four or more people wounded) since 2016 and found that charges were filed in just 21 incidents — less than 10 percent of cases. Only two people have been convicted. So far this year the city has seen at least 39 mass shootings, but only one person has been charged. Chief of Detectives Brendan Deenihan said many mass shootings in the city stem from arguments, and they aren’t prioritized over other types of shootings” (I added the bold, for obvious reasons).
Point of fact though is that most Police departments are small and mid size agencies that are not dealing with the violent crime issues that large PDs are.
And linking police arrest/clearance data with increased or decreased crime is erroneous IMO. It’s what happens in courts after the arrest that impacts crime rates. Especially in the age or bail reform and revolving court room doors….
I agree with the thrust and conclusion here. The devil’s advocate would say that once the low-hanging crime is resolved over time, the remaining marginal long-tail takes more effort to resolve per crime, explaining away the lack of productivity improvement. But that’s no excuse. If I was only 30% good at my job, I wouldn’t have a job. Why does this stand? Obscene.